CASE STUDY
Data & Analytics 2025
Traffic Accident Analysis with FP-Growth
A web application for processing traffic accident records and finding relationships between incident factors with FP-Growth. Results are presented through association rules, dashboards, GIS hotspot maps, analysis history, CSV exports, and reports.
TECHNOLOGIES USED
Python / Flask / SQLAlchemy / SQLite / Pandas / mlxtend / Bootstrap 5 / Leaflet / Waitress
PROBLEM
Accident records contain many attributes, including time, weather, road conditions, vehicle types, casualty severity, and location. Manually reading tables is not enough to find recurring factor combinations or areas with high incident concentrations as the dataset grows.
MAIN FEATURES
-
01
CSV & XLSX imports
Data structure is validated and normalized before storage and analysis.
-
02
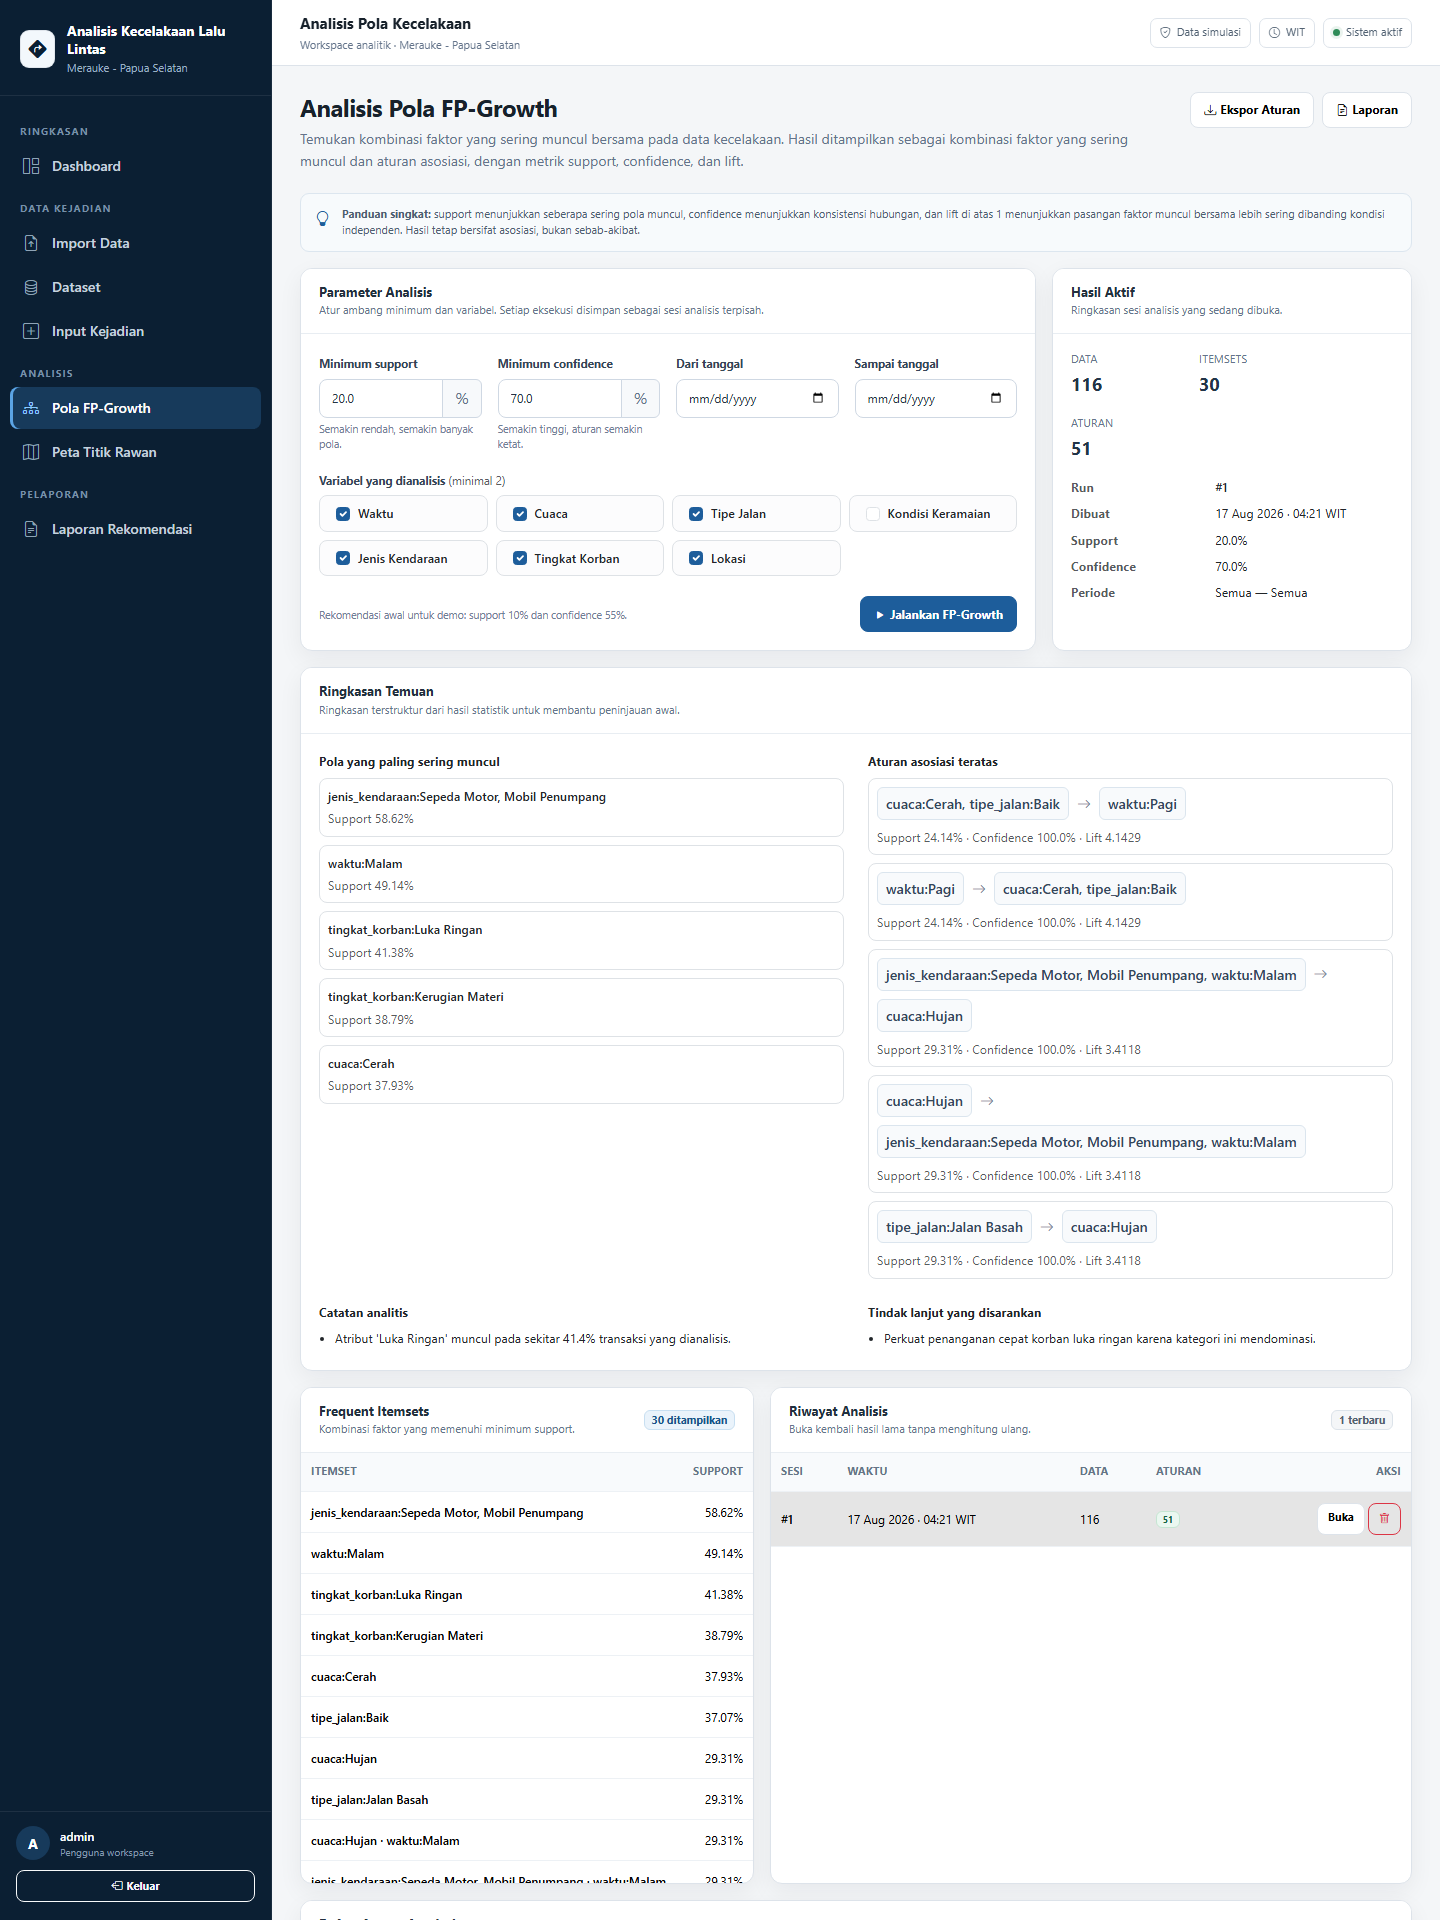
FP-Growth parameters
Date range, attributes, support, and confidence can be set for each analysis.
-
03
Itemsets & association rules
Results include support, confidence, lift, and session history that can be reopened.
-
04
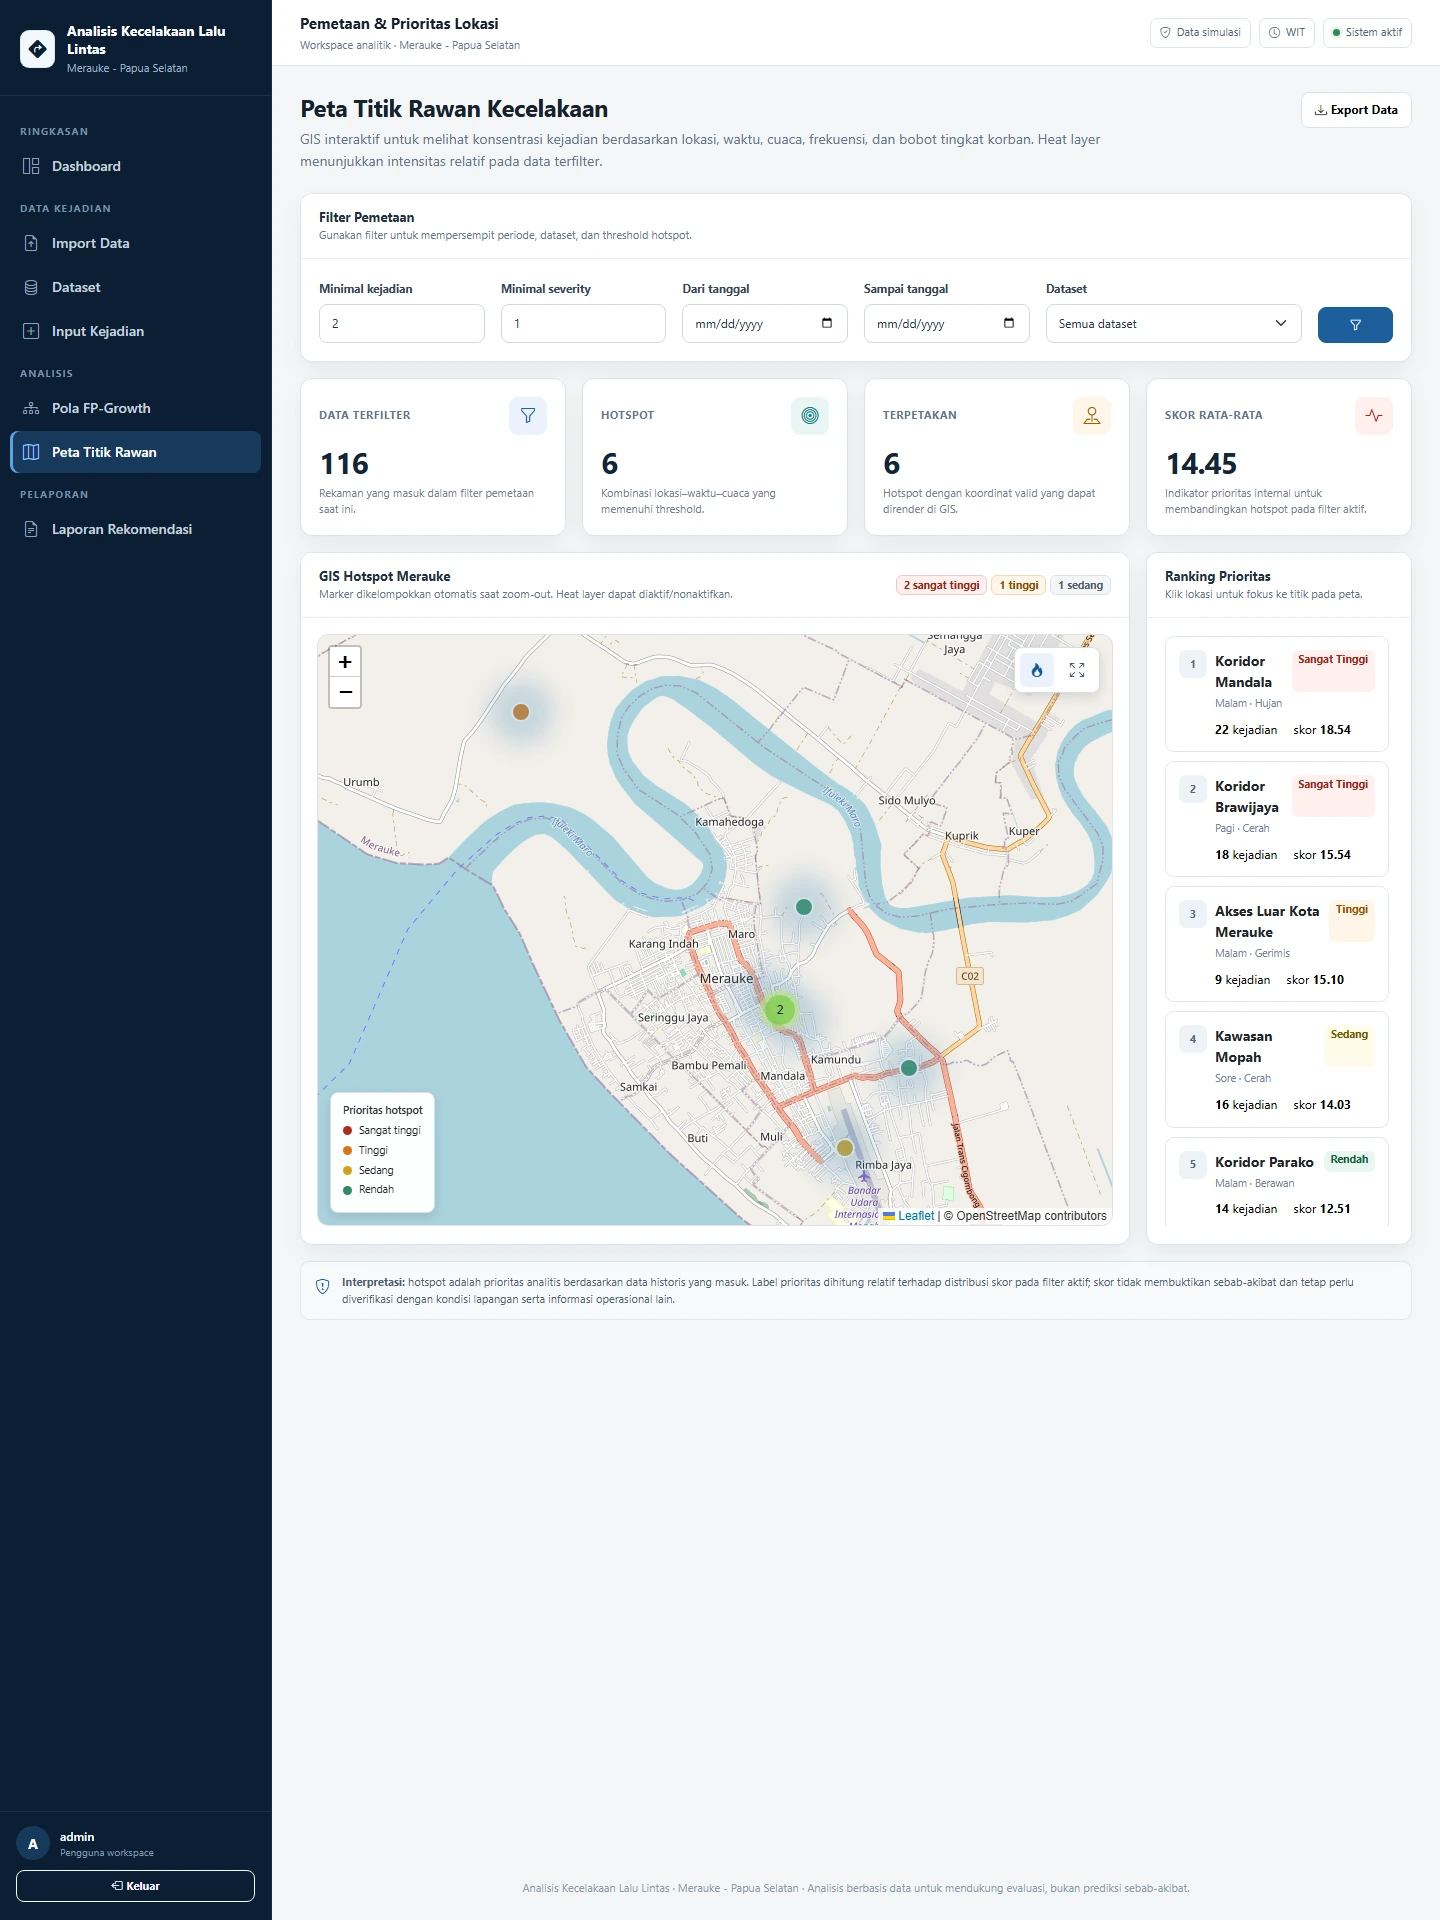
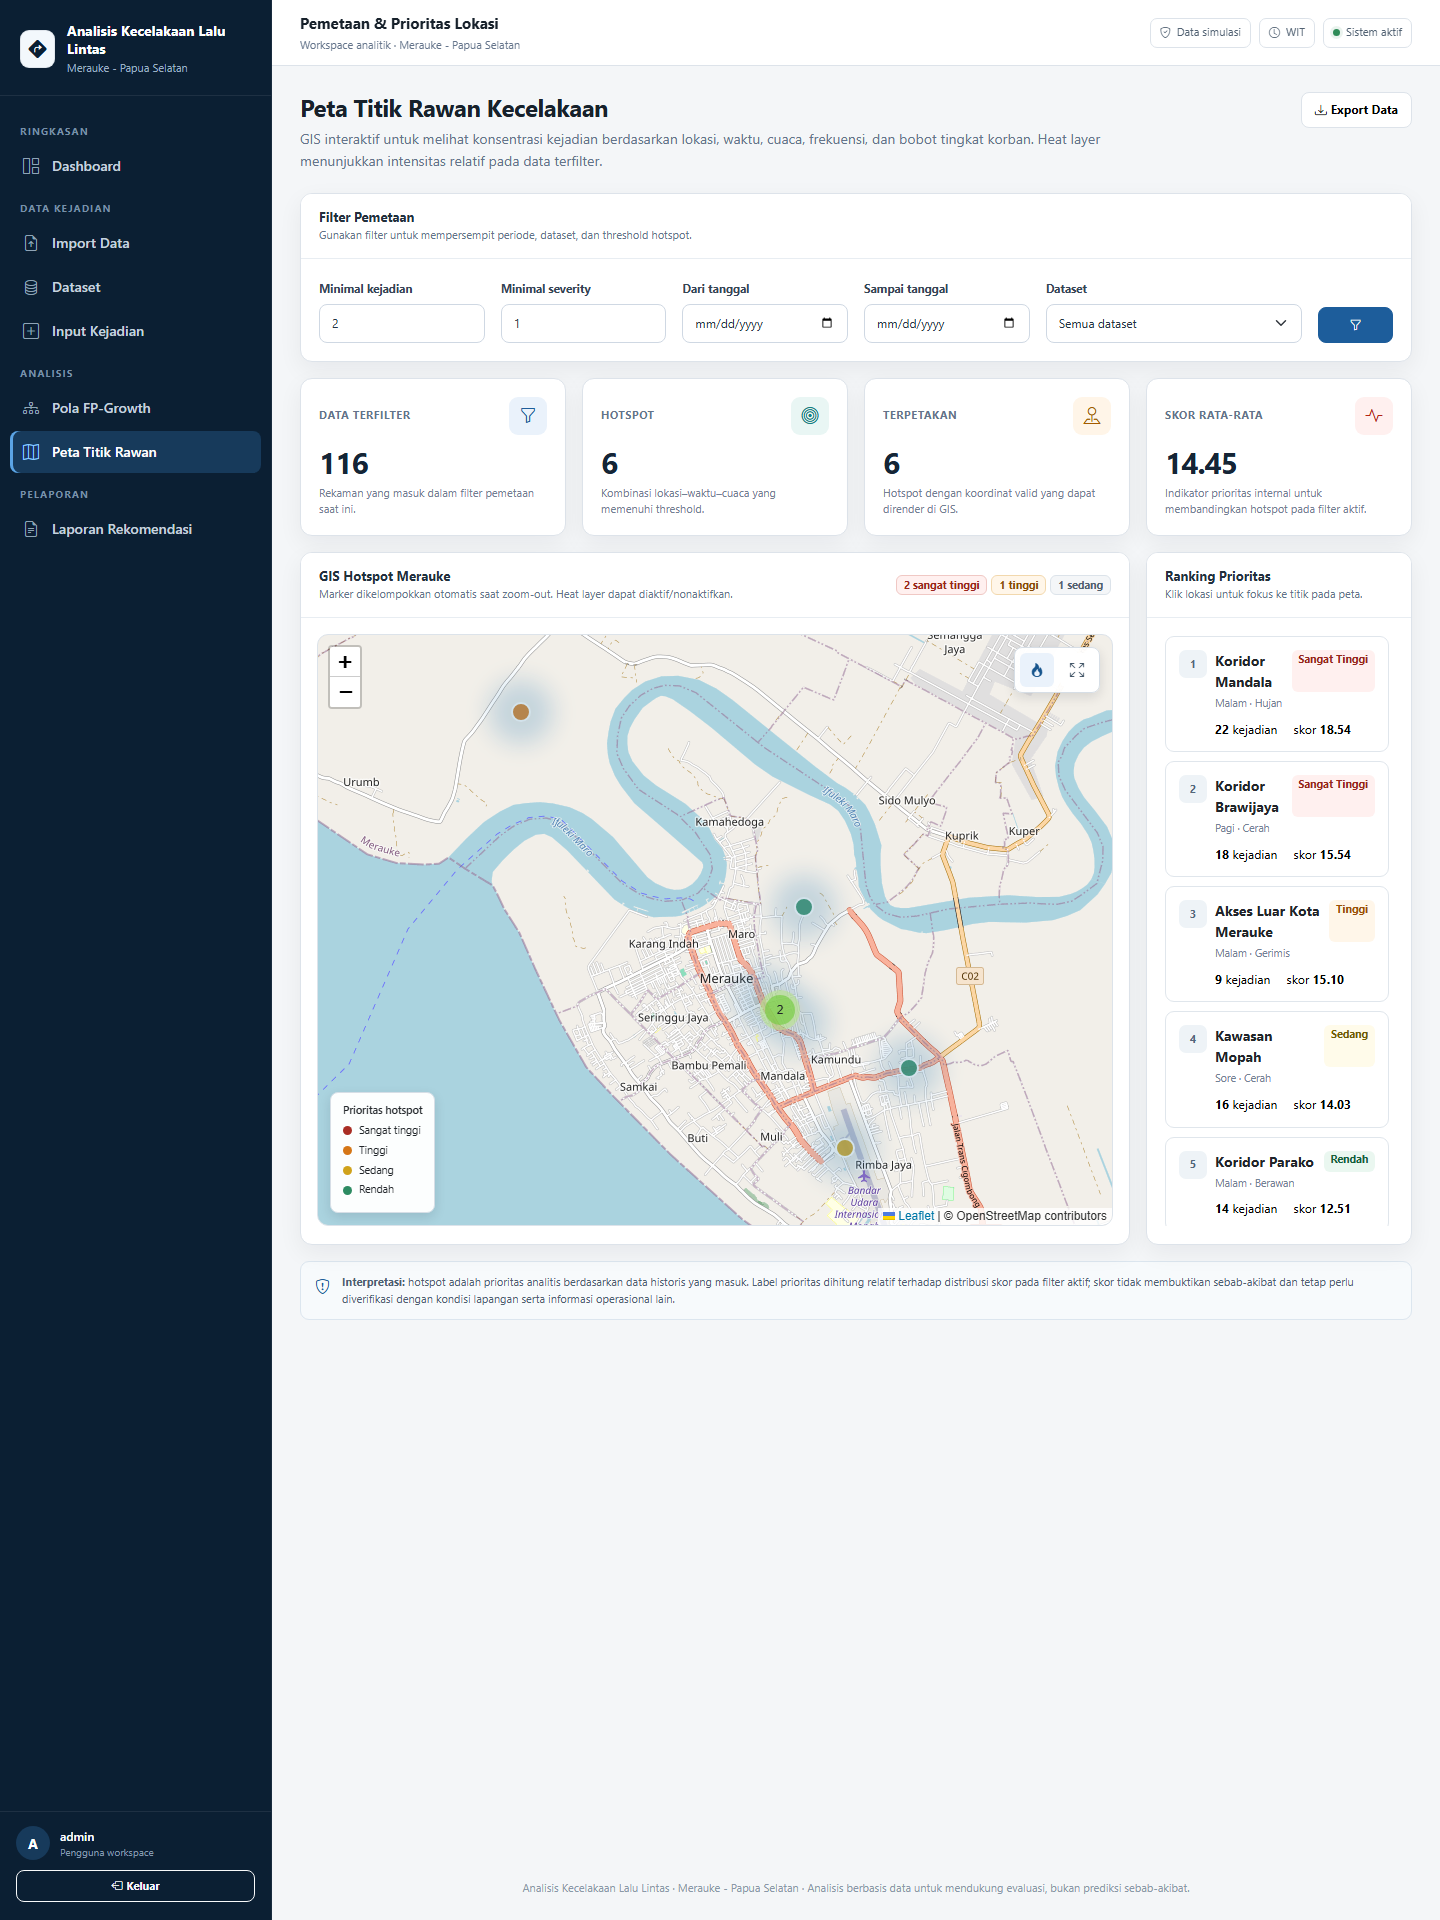
GIS hotspot mapping
A heat layer, marker clusters, hotspot scores, and location rankings help explain incident distribution.
-
05
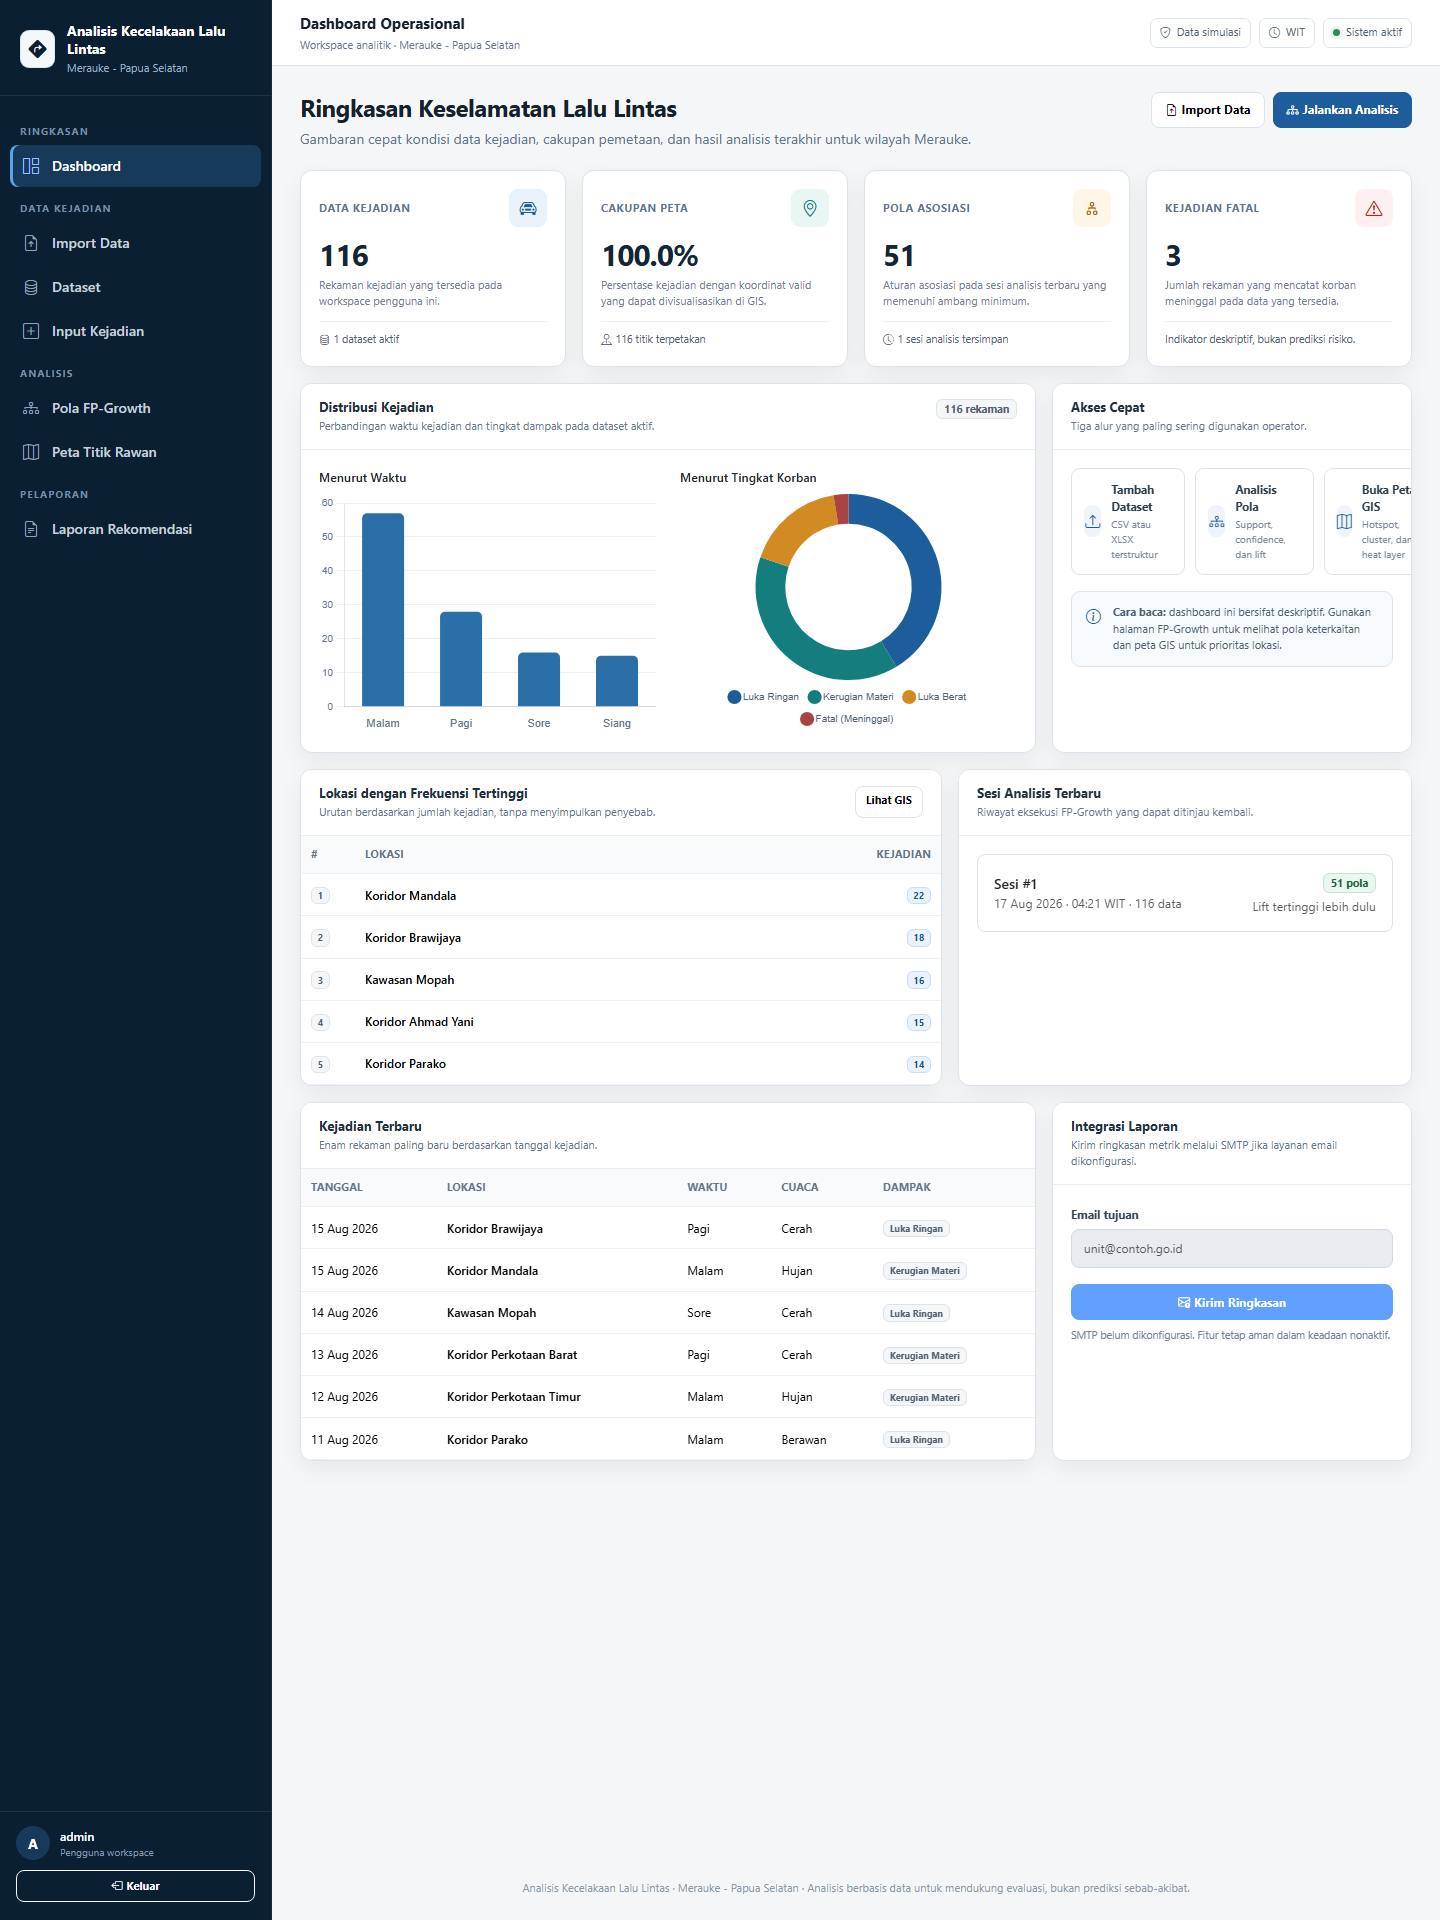
Dashboards & report outputs
Results can be reviewed through visualizations, CSV exports, and printable recommendation reports.
IMPLEMENTATION
The Flask backend handles CSV or XLSX imports, validation, normalization, and dataset storage for each user. Before running FP-Growth, users choose the period, attributes, support value, and confidence value. Frequent itemsets and association rules are saved in the analysis history. Leaflet displays a heat layer, marker clusters, and hotspot rankings based on frequency and severity. Results can also be viewed on the dashboard, exported to CSV, and printed as a report.
PROJECT SCREENS
 Open screen 01 at full size
 Open screen 02 at full size
 Open screen 03 at full size
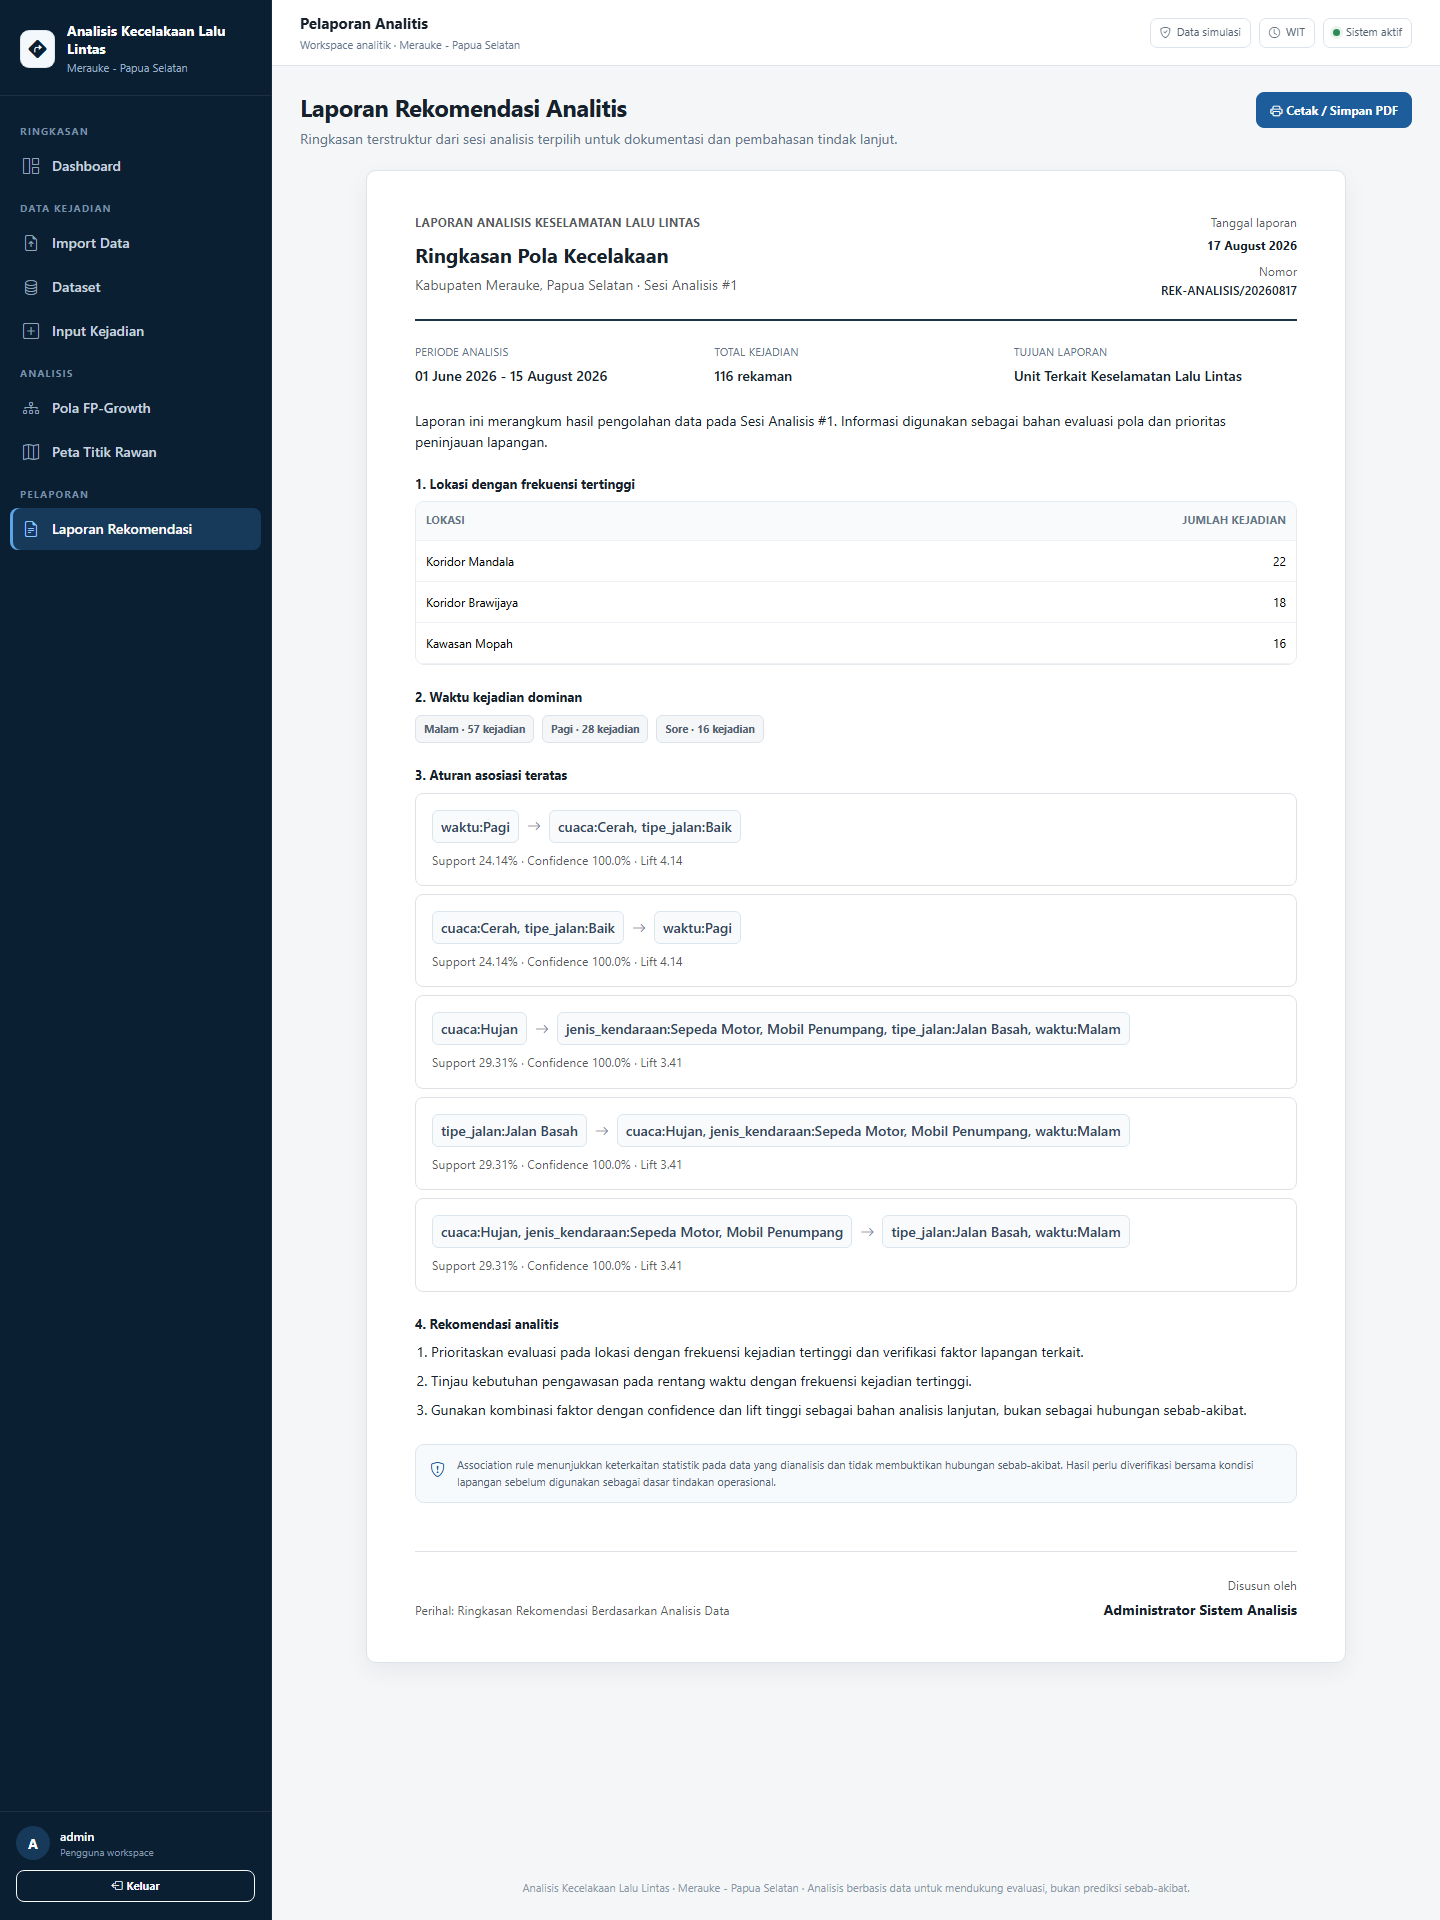 Open screen 04 at full size
RESULT
Each session stores frequent itemsets and association rules with their support, confidence, and lift values. Users can view incident locations on a map, compare hotspots, export results to CSV, and print reports.
Need an application for a similar workflow?
Tell me who will use it, how the current process works, and which features are required. I’ll review the requirements before discussing the technical solution.
Talk About a Project